 Ask Evie
Introduced in iOS 16, Charts is a powerful and concise SwiftUI framework for transforming our data into informative visualizations. With SwiftUI Charts, we can build effective and customizable charts with minimal code. If you are new to the Charts framework, you can check this article that we published earlier.
iOS 17 brings few exciting improvements to Charts — scrolling charts, support for selection & pie charts. In this article, we will focus on pie charts and learn how to use them with few lines of code.
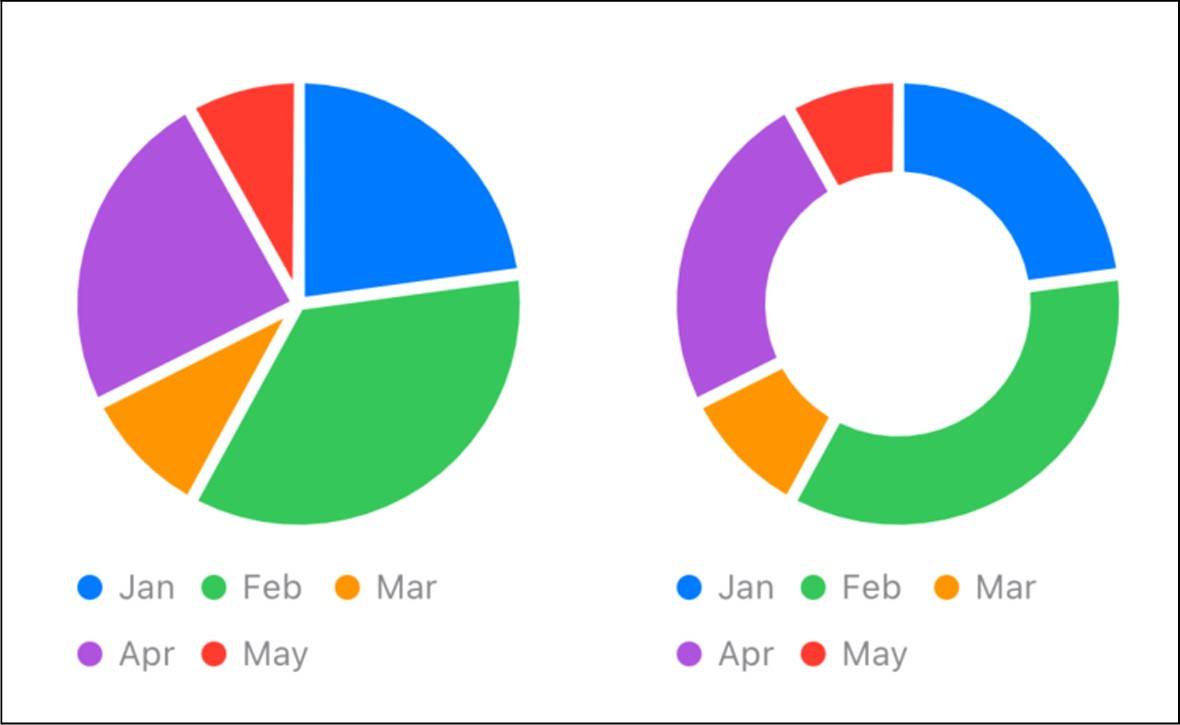
A pie chart is useful for showing how a set of data is distributed across different categories in a circular manner. For our example, let’s consider we have sales data per month. We would like to visualize sales volume using pie chart.
Westart by creating a new iOS project in Xcode 15 (which is in beta at the time of writing). Wedeclare a simple data model called MonthlySales, which has two properties — name of the month & sales volume. It also conforms to Identifiable protocol.
struct MonthlySales:
Identifiable {
     init(month: String, salesVolume: Double) {
     self.month = month
     self.salesVolume = salesVolume
}
   let id = UUID()
   let month: String
   let salesVolume: Double
 }
 Wealso create an array with few sample data
let allData = [
    MonthlySales(month: "Jan", salesVolume: 5.9),
    MonthlySales(month: "Feb", salesVolume: 9.0),
    MonthlySales(month: "Mar", salesVolume: 2.5),
    MonthlySales(month: "Apr", salesVolume: 6.2),
    MonthlySales(month: "May", salesVolume: 2.1),
 ]
 Wecan easily create a pie chart using the above data as follows
Chart(allData) { data in
   SectorMark(
   angle: .value("Sales", data.salesVolume),
   angularInset: 2.0
 )
 .foregroundStyle(by: .value("Month", data.month))
 }
To create a pie chart (or any other chart), we use the Chart view. We represent individual categories (or a sector of the pie chart) using the SectorMark view. We provide values for angle and angularInset to the SectorMark.
The angle argument takes values of type PlottableValue. We create instances of PlottableValue by using astatic function by providing the label key and value. We use the string “Sales” as label key and salesVolume values as value
The angularInset value determines the gap between each sector.
By adding the foregroundStyle view modifier, we get different colors for each sector of the pie chart.
So this is the complete code to generate the above pie chart in SwiftUI –
import SwiftUI
 import Charts
   struct MonthlySales: Identifiable {
   init(month: String, salesVolume: Double) {
   self.month = month
   self.salesVolume = salesVolume
 }
   let id = UUID()
   let month: String
   let salesVolume: Double
 }
 let allData = [
   MonthlySales(month: "Jan", salesVolume: 5.9),
   MonthlySales(month: "Feb", salesVolume: 9.0),
   MonthlySales(month: "Mar", salesVolume: 2.5),
   MonthlySales(month: "Apr", salesVolume: 6.2),
   MonthlySales(month: "May", salesVolume: 2.1),
 ]
 struct ContentView: View {
   var body: some View {
   Chart(allData) { data in
   SectorMark(
   angle: .value("Sales", data.salesVolume),
   angularInset: 2.0
  )
.foregroundStyle(by: .value("Month", data.month))
  }
  .padding()
  }
 }
 Wecan turn this pie chart into donut chart by simply providing value for innerRadius to the
   SectorMark view.
   Chart(allData) { data in
 SectorMark(
   angle: .value("Sales", data.salesVolume),
   innerRadius: .ratio(0.6),
   angularInset: 2.0
 )
 .foregroundStyle(by: .value("Month", data.month))
 }
Here, innerRadius is set as the ratio of the full radius of the pie. By simply making this single change to our existing code, we get this nice looking donut chart –